
Most production issues aren’t hard to fix.
They’re hard to understand.
I’ve seen plenty of incidents where there was no shortage of data. Logs were flowing, metrics were charted, alerts were firing. And yet the first hour was spent guessing. What changed? Where did it start? Is this user behaviour, a downstream dependency, or something we introduced?
Over time, one of the biggest improvements I’ve seen in reducing that uncertainty came from using Azure Application Insights deliberately. Not just turning it on, but treating observability as part of the system design.
Logging isn’t about volume
A line I keep coming back to is:
“If everything is important, nothing is.”

When everything is logged at Information, operators lose the ability to tell what actually matters. Logging levels are not a volume control. They are a signalling mechanism. They are part of the language your system uses to communicate with the people responsible for running it.
In practice:
Informationshould describe expected, actual system behaviourWarningshould indicate something abnormal that may need attentionErrorshould mean the system failed to do what it was meant to doDebugshould exist for focused, time-boxed investigation, not permanent noise
Once these distinctions blur, diagnosis slows down, even if you are collecting a lot of data.
Not everything should be a log line
One useful shift in thinking is being clear about why you are emitting telemetry in the first place.
- Logs help explain why something happened
- Metrics tell you that something is happening, and how often
- Custom events capture meaningful behaviour and intent
Not every action deserves a log entry. Some deserve a metric. A small number deserve to be recorded as domain-level events that reflect how users and workflows actually behave.
When telemetry is designed around intent rather than convenience, production behaviour becomes much easier to reason about. You stop staring at exceptions and start understanding outcomes.
Logging has a real cost
Excessive logging doesn’t just slow diagnosis. It costs money.
Every log line has a price: ingestion, storage, retention, and query time. When systems log indiscriminately, costs grow quietly in the background until someone eventually asks why monitoring has become so expensive.
More importantly, noisy logs don’t just cost more to store. They cost more to use.
When engineers have to sift through vast amounts of low-value telemetry to find the signal, investigations take longer and confidence drops. The system becomes harder to operate, even though it is technically “well instrumented”.
There is a direct relationship between intentional logging and sustainable observability costs.
Track what matters, not what is easy
It is tempting to focus on what is readily available. CPU, memory, request counts, error rates. All of these are useful, but rarely sufficient on their own.
The most valuable telemetry I have seen usually captures context, for example:
- Key decision points in a workflow
- Time spent between meaningful stages
- Success and failure in business terms
- Latency at system boundaries rather than deep internals
The goal is not to know everything. It is to know enough to understand whether the system is behaving as expected.
Durable orchestrations make observability unavoidable
This becomes especially clear when working with long-running or distributed workflows. Durable orchestrations introduce retries, waits, fan-out, fan-in, and partial failure over time. Without good correlation, reconstructing what happened can turn into a forensic exercise.
Hierarchical traces make a genuine difference here. Being able to see parent and child relationships between orchestrations and activities turns an incident into a readable narrative. Instead of stitching together timestamps and IDs across log files, you can follow the execution as it actually happened, including retries and delays.
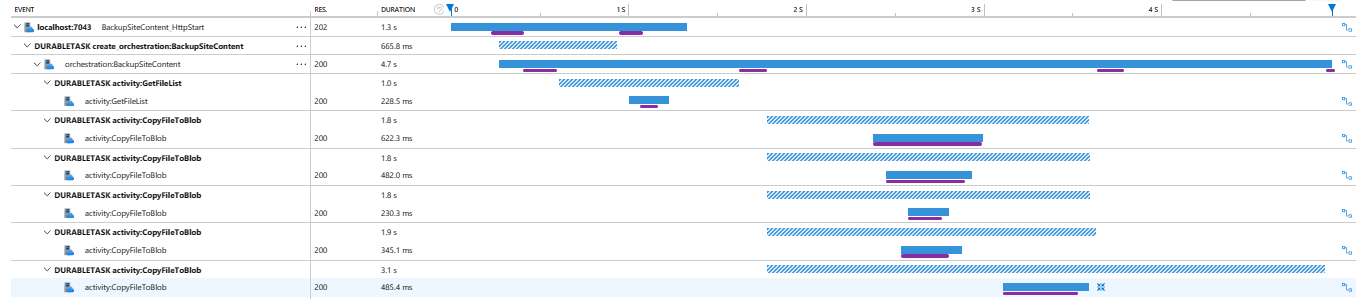
At that point, diagnosis shifts from guesswork to observation.
Making telemetry usable
Collecting good telemetry is only half the job. The other half is making it visible and actionable.
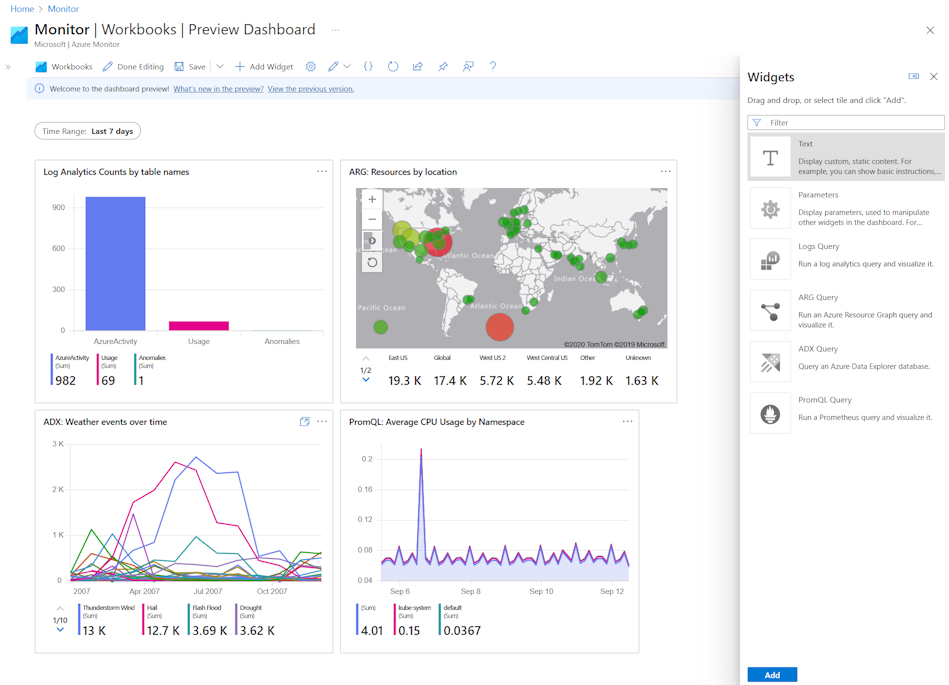
Workbooks are often underestimated. Used well, they become shared views of system behaviour rather than static dashboards. They answer the questions people actually ask during incidents and reviews, not just what the platform happens to expose.
Effective workbooks tend to:
- Combine technical metrics with domain-level events
- Make trends and deviations obvious
- Reflect what “normal” looks like
Dashboards serve a similar purpose, but for a different moment. A good dashboard does not try to show everything. It answers one simple question: is the system behaving as expected right now?
Alerts require the most discipline. Alerting on every spike or error quickly leads to noise and fatigue. Alerting on conditions that represent real risk to value delivery changes behaviour.
The most effective alerts I have seen:
- Trigger on sustained conditions, not momentary blips
- Reflect user or workflow impact where possible
- Are actionable by design
If an alert fires, someone should care.
What I would design in from day one
A few things I now treat as non-negotiable:
- Correlation IDs everywhere
- Clear, shared expectations around logging levels
- Intent-based custom events
- Metrics that reflect flow, not just throughput
- Regular reviews of what gets logged and why
Observability is not something you bolt on after incidents start happening. It is part of the architecture.
Good observability does more than reduce mean time to recovery.
It reduces uncertainty, stress, and heroics.
And when systems are easier to understand, teams build and operate them with far more confidence.